How to load data to generate data visualizations through Hugo shortcodes?

Hugo native shortcodes don’t manage data visualizations. However, I found a Hugo theme (DoIt) that handles data visualizations through shortcodes with ECharts. With this theme, ECharts option just has to be inserted in JSON, YAML or TOML format in the ECharts shortcode.

Here is an example:

{{< echarts >}}
{
"xAxis": {
    "type": "category",
    "boundaryGap": false,
    "data": ["Mon", "Tue", "Wed", "Thu", "Fri", "Sat", "Sun"]
  },
  "yAxis": {
    "type": "value"
  },
  "series": [
    {
      "data": [820, 932, 901, 934, 1290, 1330, 1320],
      "type": "line",
      "areaStyle": {}
    }
  ]
}
{{< /echarts >}}

Instead of having the data directly within the shortcode, how could I load it from a CSV or a JSON file?

Data in the mentioned example:

|----------+-------|
| category | value |
|----------+-------|
| Mon      |   820 |
| Tue      |   932 |
| Wed      |   901 |
| Thu      |   934 |
| Fri      |  1290 |
| Sat      |  1330 |
| Sun      |  1320 |
|----------+-------|

input.csv:

category,value
Mon,820
Tue,932
Wed,901
Thu,934
Fri,1290
Sat,1330
Sun,1320

input.json:

[
  {
    "category": "Mon",
    "value": 820
  },
  {
    "category": "Tue",
    "value": 932
  },
  {
    "category": "Wed",
    "value": 901
  },
  {
    "category": "Thu",
    "value": 934
  },
  {
    "category": "Fri",
    "value": 1290
  },
  {
    "category": "Sat",
    "value": 1330
  },
  {
    "category": "Sun",
    "value": 1320
  }
]

There’s another Apache ECharts example here:
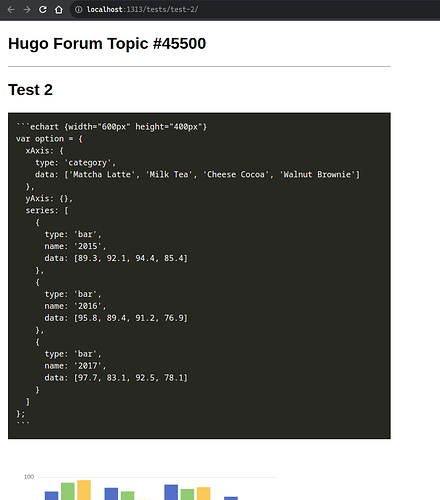
https://discourse.gohugo.io/t/need-help-with-apache-echarts/45500/4

In the 3 examples provided in GitHub - jmooring/hugo-testing at hugo-forum-topic-45500 the data is always inside the ECharts code. My question is about how to have it loaded instead.

Do you want the data files associated with the page on which the chart is displayed, or do you want them globally available to use on any page?

I would prefer to have them globally available but it wouldn’t be a necessity. Ideally, the data file would be loaded from a URL, e.g.:
https://raw.githubusercontent.com/morgandavidson/moji/main/Projects/Data_sources/World/Population/API_SP.POP.TOTL_DS2_en_csv_v2_6298256.csv.

This is an example (tests 1-3) of loading an EChart data file from the data directory of your project. It’s a simple shortcode specifying the data object, and optionally width/height.

git clone --single-branch -b hugo-forum-topic-47999 https://github.com/jmooring/hugo-testing hugo-forum-topic-47999
cd hugo-forum-topic-47999
hugo server

You should be able to use this as a model for getting remote JSON data.

Using CSV data, either local or remote, requires a bit more work because you need to wrangle it into a map.

Also, the CSV you reference above is invalid due to the first 4 lines.

I do data preparation with Pandas, so it is easy to export DataFrames to JSON instead of CSV (for example, this script can produce this JSON).

I’m really sorry, but I don’t understand your answer. When I look at these 3 examples I still see the data inside the code, i.e. not loading a data file from a data directory.

I guess I’m missing something due to my poor understanding of JS…

{{ with $data := index site.Data.echarts $dataObject }}
...
<script>
  ...
  var option = {{ $data }};
  ...
  chart.setOption(option);
  ...
<script>

This might be something to outsource. You could post a “help wanted” topic in the “services” category of this forum.

I don’t see this block in your 3 examples:

I apologize… wrong branch. Try this:

git clone --single-branch -b hugo-forum-topic-47999 https://github.com/jmooring/hugo-testing hugo-forum-topic-47999
cd hugo-forum-topic-47999
hugo server

Look at tests 1-3.

Thank you. In these new exemples I see that test-1.md, test-2.md and test-3.md are loading charts located in the data folder.

Though, I can’t fine the block you mentioned earlier:

<script>
  ...
  var option = {{ $data }};
  ...
  chart.setOption(option);
  ...
<script>

Also, from my understanding, what is loaded in these exemples are not data files but, JSON files containing ECharts code containing data.

The block I mentioned earlier is in the shortcode.

To do what you want to do…

  1. Place the chart options in local data file
  2. Use the resources.GetRemote and transform.Unmarshal functions to get the remote data
  3. Build your data series from the result of step 2
  4. Merge the data series into the data from step 1 using the merge function
  5. Use the jsonify function on the result of step 4 and pass that into “options”

Or something pretty close to that.

1 Like

It seems quite complicated… Wouldn’t it be possible to have the following solution ( see ECharts documentation ) working with hugo:

var myChart = echarts.init(document.getElementById('main'));

$.get('data.json').done(function(data) {
  // Structure of data:
  // {
  //     categories: ["Shirt","Wool sweater","Chiffon shirt","Pants","High-heeled shoes","socks"],
  //     values: [5, 20, 36, 10, 10, 20]
  // }
  myChart.setOption({
    title: {
      text: 'Asynchronous Loading Example'
    },
    tooltip: {},
    legend: {},
    xAxis: {
      data: data.categories
    },
    yAxis: {},
    series: [
      {
        name: 'Sales',
        type: 'bar',
        data: data.values
      }
    ]
  });
});

Sure, you could simplify a bit if you want to hard code the chart options into the shortcode. But you’ll still need to do steps 2-3, and maybe a bit of 4 and 5 depending on how you set it up.

The difficulty of step 3 will depend on the original data structure and the data structure needed by the ECharts API.

Ok, thank you very much. My current knowledge does not allow me to fully understand your explanations. But I guess you provided the correct solution. It is unfortunate that Hugo doesn’t provide an easy solution for generating Data Vizualisations that need Asynchronous Data Loading.

Well, that sort of depends on experience, but I get your point. I took me about 10 minutes to put the examples together, so…

Exemples with only data in the data folder would have been a huge help.

This topic was automatically closed 2 days after the last reply. New replies are no longer allowed.